PDD Geoguessr #30: Minnesota and the Presidential Election

Minnesota 2024 presidential election results by county.
Minnesota’s electoral college votes have gone to the Democrats since 1976, longer than any other state. But unlike Washington D.C., which went 90% for Harris and has given its three electoral votes to the Democrats since 1964 (but is not a state), Minnesota’s politics are a bit more complicated. In its most simplistic form, the strongly left-leaning Twin Cities metro area counters the right-leaning Greater Minnesota population, with a few urban areas creating pockets of blue. But that’s the simplistic version. This post looks at the Minnesota results at the precinct level and includes three Greater Minnesota Geoguessr challenges. One visiting the precincts where Trump had the highest margins of victory, another for the precincts that went most strongly to Harris, and a third for precincts split right down the middle.
Two years ago, when Governor Tim Walz beat Republican Scott Jensen to win re-election, those looking at the election data noticed a decided shift in voting patterns, with the geographic polarization between the Twin Cities and Greater Minnesota increasing. This year, with Walz on the ballot nationally, a similar pattern was seen. Overall voter turnout in Minnesota went down (while still possibly being the highest in the country), but increased in the rural Republican areas of Minnesota. Looking at a county by county maps seems to reveal exactly how a person voted based on where they lived. Looking at the data at a precinct level shows a bit more nuance in Greater Minnesota (Greater Minnesota is defined here as all of Minnesota minus the 14 counties in the Minneapolis-St. Paul Bloomington Metropolitan Statistical Area).
That being said, in some precincts, you could actually tell exactly how someone voted based on where they lived. Sixteen precincts in Greater Minnesota voted entirely for Trump. Two precincts had all of their votes go to Harris. This does not reflect a general preference for Trump so much as it reflects Greater Minnesota having a lot of very small rural precincts that favor Trump. The largest precinct to vote entirely for Trump had 32 people voting; for Harris, 2 voters. In these instances, if you know someone who voted in one of these precincts, then you know how they voted, which makes me question the wisdom of releasing precinct-level data, at least in very small precincts (the precinct-level results described here came directly from The Office of the Minnesota Secretary of State).
Because precincts with a very small number of voters probably tell you more about how a family voted than a community, the Geoguessr challenges here only look at precincts with at least 100 votes cast. The first two challenges look at the five precincts in Greater Minnesota where each candidate won with the greatest margins. Nearby precincts often had similar results and if a county showed up more than once in the top five (which happened for both parties) only one precinct in that county was included, giving the challenges more geographic diversity. Even with those qualifiers, the percentages for Trump were pretty high in some places. All five locations in the Republican challenge show precincts where Trump had between 92% and 96% of the vote. For the Democratic challenge, the range is from 76% and 92%. The third challenge looks at precincts from five different counties in Greater Minnesota where the margin between Harris and Trump was five percent or less.
I found these challenges interesting ones to make. In the time since the election, we have all likely seen countless maps of red and blue explaining who voted how. But geographers like to quote the axiom that the map is not the territory. It’s easy to look at the boxes of red and blue on the map and forget the complexity of the underlying places. These Geoguesr challenges look at the territory. A Streetview image, or course, is still an abstraction. In playing you can’t stop at any of the houses and ask anyone why they voted the way they did. But in finding the locations, I was immediately struck by the very apparent differences in the landscape, which reveals a much greater diversity in experience than shown in boxes shaded red and blue.
PDD Geoguessr 30(a): Precincts in Greater Minnesota with the highest percentage of votes for Trump
PDD Geoguessr 30(b): Precincts in Greater Minnesota with the highest percentage of votes for Harris
PDD Geoguessr 30(c): Precincts in Greater Minnesota with a difference of five percent or less between Trump and Harris
How to Play Geoguessr
GeoGuessr can be played on a laptop or desktop and on Android or IoS mobile devices with the GeoGuessr app. Just click on the link that fits how you play. You can create an account to keep track of your scores and see how you compare to other players or just click on the link above to play as a guest without having to create an account or log in.
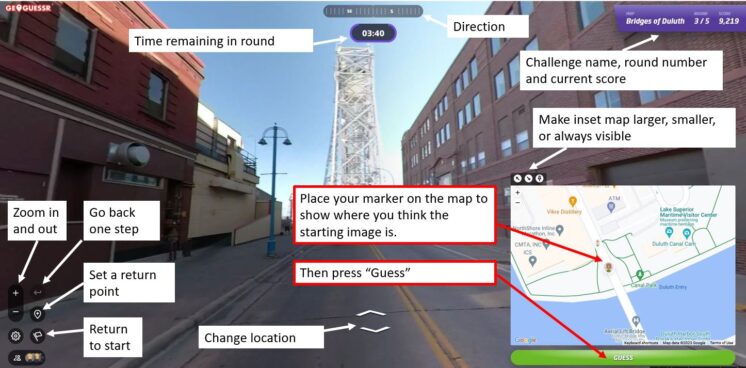
Every game consists of five locations based on a theme chosen by the game creator. You are shown a Streetview image stripped of all the informational labels that are normally overlayed onto the image. Unless the challenge specifically restricts it, you can move around and look for clues like street signs and business names to find out where you are. The image below shows a basic overview of the Geoguessr screen layout and controls.
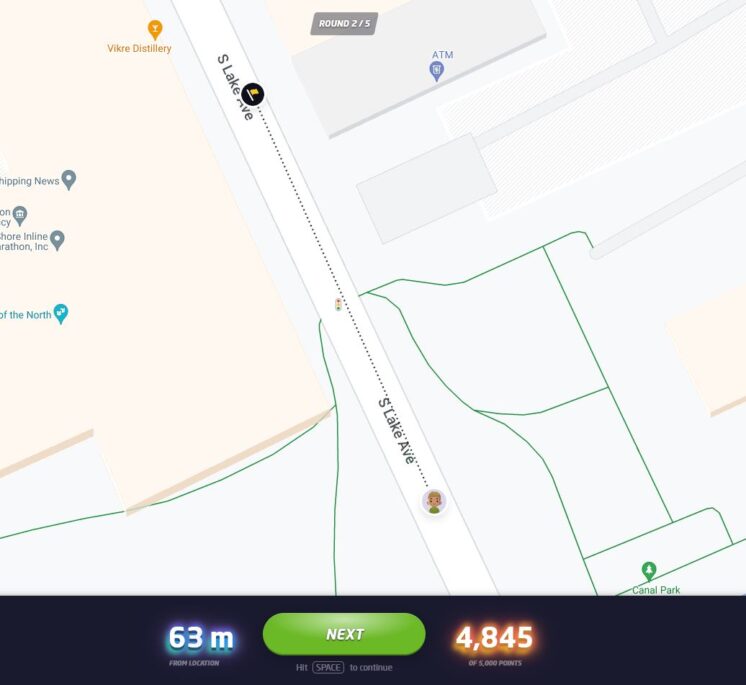
Once you think you know the location — or are nearly out of time — you use the inset map to place your marker where you believe the round started. After you hit “Guess,” you will see how close you were to the correct location and how many points your guess earned. The closer you are to the location, the higher your score, with a maximum score of 5,000 points. On a map that covers a small area, like the Gary-New Duluth neighborhood, being off by a few blocks will cost you a lot of points. On a map that has locations from around the world, you will get nearly all the points just for finding the right city. The maximum error for a perfect score also changes by map size, but in general if you are within 50 feet (15 meters) you will always get the full 5,000 points.
Not often, but every now and then, GeoGuessr gets a little buggy. If the underlying Streetview imagery has changed since the game was made, sometimes it repeats the last round, gives a black screen, or doesn’t allow a guess to be made. If that happens, please let me know and I’ll update the challenge.
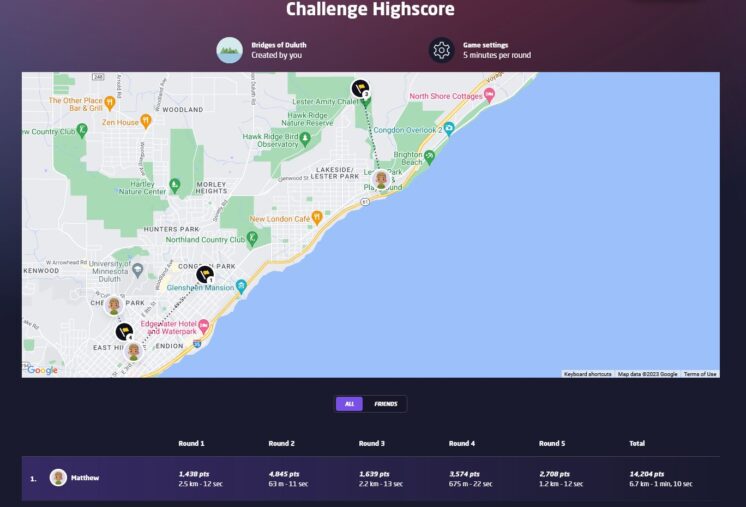
At the end of the five rounds, an overview screen shows your score for each round in addition to your guessing time and how far off you were from the correct location. The correct locations and your guesses are also shown on a map and you can click on any of the round numbers to review the locations. Additionally, the final screen in a challenge will show how you rank compared to the top scorers of the challenge. When choosing your user name, keep in mind that your user name and score per round will be visible to other players of the challenge.
If you have feedback on this challenge or ideas for future challenges, please share them in the comments below.
Recommended Links:
Leave a Comment
Only registered members can post a comment , Login / Register Here





No Comments